The Chart Widget
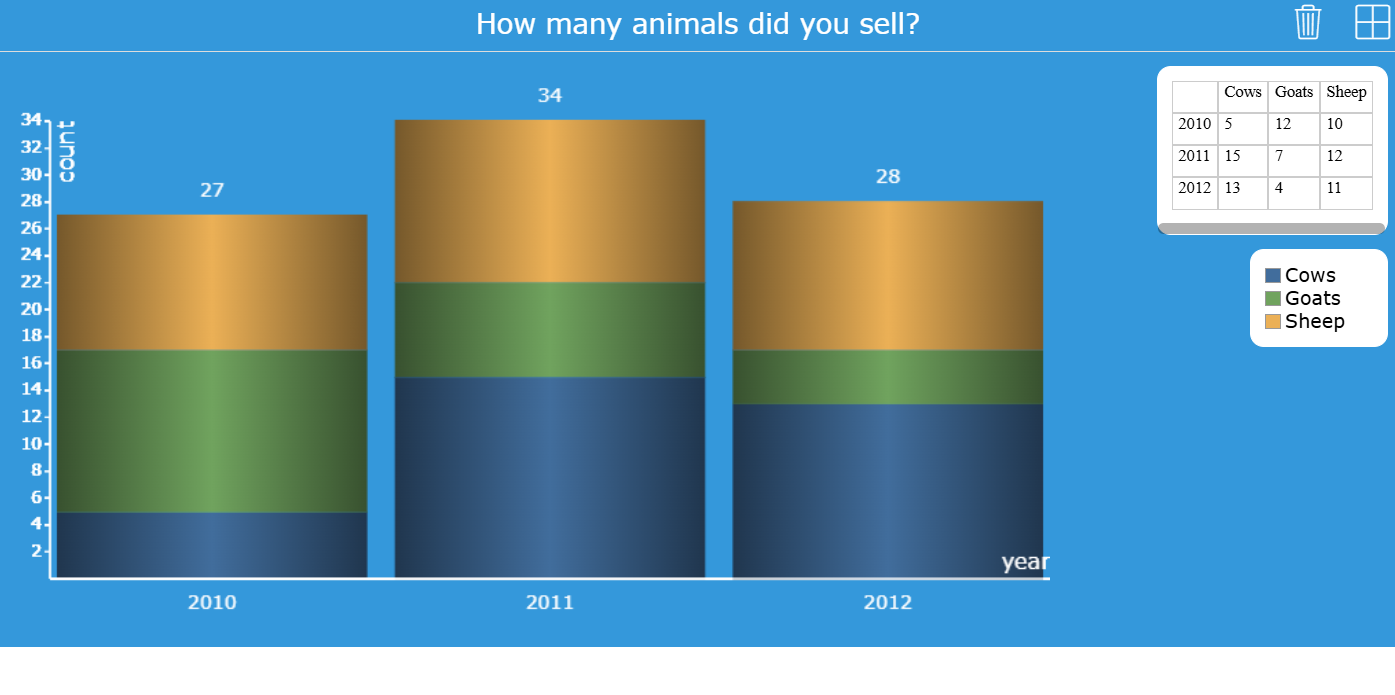
Students can fill in numerical data into a table the teacher defines, and a stacked bar chart will automatically update accordingly.
Students can fill in numerical data into a table the teacher defines, and a stacked bar chart will automatically update accordingly.
Enhance educational outcomes with customizable tools designed for every classroom.
Check out these quick lesson ideas for teachers on how to use a BookWidgets Chart activity in the classroom.
Track and compare how plants grow under different light conditions with this interactive Chart activity. Students record plant heights daily and watch the chart update in real time. This hands-on experiment helps develop skills in data collection, analysis, and scientific observation, making science concepts tangible and engaging.
Engage your students with this interactive activity that helps them track and analyze their weekly expenses. By filling in real spending data across common student categories, learners develop financial awareness and practical math skills. The live-updating stacked bar chart visually reinforces concepts like budgeting, comparison, and change over time.
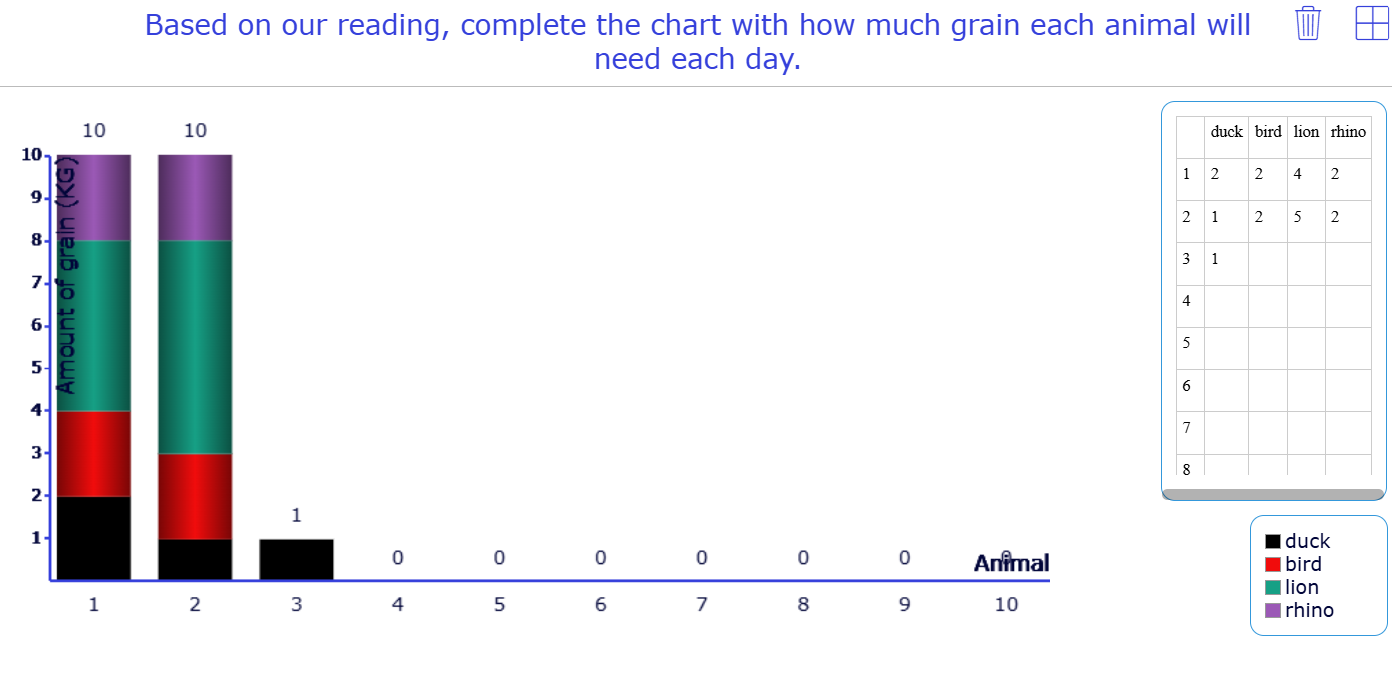
This interactive Chart activity helps students explore budgeting and decision-making by experimenting with spending combinations. It provides instant visual feedback, making abstract math concepts like proportional reasoning and addition more tangible. Designed to engage students and encourage critical thinking
Students record daily classroom temperatures at morning, midday, and afternoon intervals to observe how temperatures change throughout the day. This hands-on activity helps develop data collection and interpretation skills. The visual results make it easy to identify patterns, encouraging lively class discussions about weather changes and environmental influences.
Students collect real-world data by counting insects over multiple days and enter their findings into an interactive Chart that updates instantly. This hands-on science exercise introduces students to biology, helping them visualize patterns and trends while developing observation and data analysis skills. It’s an engaging way to connect classroom learning with outdoor exploration and nature.
Bring learning to life with a realistic sales simulation where students track weekly product sales over four weeks. Using this interactive Chart activity, students fill in sales data from a provided scenario and instantly visualize trends and product performance. For an even smoother learning experience, combine the Chart Widget with a Split Worksheet Widget. Allowing students to read the scenario and update the graph side by side.
We’ve gathered some interesting blog posts from the BookWidgets teacher blog that show Chart widget lesson plans and the configuration possibilities for teachers.